Key Takeaways
- Crown Castle REIT is an equity REIT in the infrastructure sector that’s been publicly traded since 2014. It invests mainly in communication infrastructures such as cell towers, small cells, and fiber networks.
- Crown Castle REIT owns (or has the rights to the land), manages, and leases out >40,000 towers, ~80,000 small cells, and ~80,000 route miles of fiber. Their industry expertise spans public sectors, media and entertainment companies, commercial real estate, and other businesses with connectivity needs.
- The majority (>90%) of its outstanding shares are owned by institutional investors.
- Their biggest tenants are T-Mobile, AT&T, and Verizon — all of which sums up to 76% of their rental revenues in 2020.
- Crown Castle REIT issues quarterly dividends. Since they doubled in size in 2017, their dividends per share have consistently increased through the years with a compounded annual rate of 9%.
- When compared with its top competitors — American Tower REIT and SBA Communications REIT — CCI ranks the lowest. AMT’s and SBAC’s advantage over CCI is their extensive international operations. Meanwhile, CCI is focused on the U.S. market.
Company Background
 Crown Castle Corporation has been in the communication infrastructure business for more than 25 years. They maintain cell towers, smart cells, and fiber networks as one of the top leading providers of communication infrastructure in the U.S. Their target markets are public sectors (government and education), wholesale providers, and large enterprises across a wide variety of industries that all need a digital partner to stay connected to their customers.
They started way back in 1994 in Houston with just 133 cell towers. Now, Crown Castle owns, manages, and leases more than 40,000 cell towers in addition to small cells and fiber. And it has more than 100 offices located across the U.S. In 2020, they were officially part of the Fortune 500 list for the first time with approximately 5,000 employees. Their corporate headquarters is located at 1220 Augusta Drive Suite, Houston, Texas, U.S.A.
The strongest advantage of Crown Castle from their peers in the REIT industry is they take advantage of the increasing demand for digital connections. In this day and age, especially with the changes accelerated by the pandemic, more and more businesses shift towards digital transformation. Crown Castle is their much-needed reliable partner to stay connected digitally.
Crown Castle REIT Type
Crown Castle REIT falls under publicly traded, equity type of REIT in the infrastructure sector.
Publicly-Traded REIT
Before trading as a REIT, Crown Castle went public when its IPO was announced on August 18, 1998, through NASDAQ. They raised about $182 million with about 1,400 cell towers at that time. In 2001, they transferred to the NYSE, but still as common stock. It wasn’t only in 2014 when they commenced operating as a REIT with 40,000 towers. Today, Crown Castle REIT is traded publicly in the New York Stock Exchange with the ticker symbol NYSE: CCI.
Equity REIT
Crown Castle REIT gets its revenue from long-term lease contracts with an extensive variety of industry expertise. They can cater their services to any industry that needs connection. They own or have rights to the land on which these communication infrastructures are built. They lease out and maintain these real estate properties for a period between 5 to 15 years, with renewal periods between 5 to 10 years.
Infrastructure Sector
Crown Castle REIT’s investment portfolio consists of communication infrastructures such as telecommunication towers, fiber networks, smart city solutions, and data centers. Aside from owning and managing them, Crown Castle also assists their clients closely to meet their special connectivity needs — from project planning, network design, implementation, monitoring, and support.
What Crown Castle REIT Fund Invests In
Cell Towers, Small Cells, and Fiber Networks
The Crown Castle REIT invests in communication infrastructure which connects the communities to information, ideas, and innovations through data and wireless services. They own more than 40,000 cell towers, 80,000 small cells, and 80,000 route miles of fiber. For areas without cell towers, they can offer 10,000 rooftop sites instead. All of these network assets are spread out in 49 states of the U.S. and one U.S. territory.
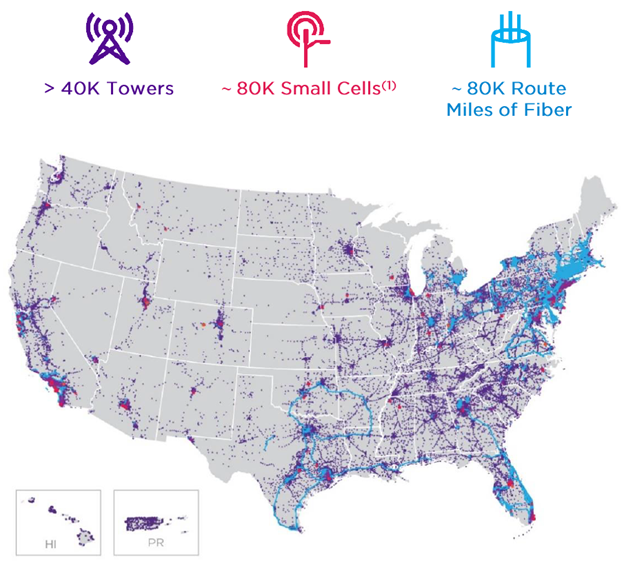 Source: Crown Castle (2nd Quarter 2021 Earnings Conference Call)
- Cell towers — carry voice and data sent and received between wireless devices
- Small cells — provide more wireless coverage nearer to the ground when cell towers are not available. They are usually placed in utility posts and street lights.
- Fiber — most internet service providers use fiber optic cables because of the fast transmission of data. Fiber network covers a lot of high-tech services such as Ethernet, bandwidth on demand, cyber defense one, fixed wireless, managed SD-WAN, internet access, DDoS defense, ultra-low latency, optical encryption, colocation, video transport, private networks, wavelength, dark fiber, and cloud connect
Acquired Assets
Over the years, Crown Castle REIT has grown steadily because of acquisitions in infrastructure. They grew twice in size in 2013 and 2017. The year 2017 was their biggest year yet because of the sizable acquisitions from Lightower Fiber Networks and Wilcon.
| Company | Year Acquired | Price | Remarks |
| Lightower Fiber Networks | July 2017 | $7.1B | Combined additional 33,900 route miles of fiber |
| Wilcon | April 2017 | $600M | |
| FIbernet Direct | November 2016 | $1.5B | – |
| Tower Development | April 2016 | $461 M | Approximately 11,500 route miles of fiber in Florida and Texas |
| Sunesys | April 2015 | – | More than 10,000 route miles of fiber in Los Angeles, Philadelphia, Chicago, Atlanta, and northern New Jersey |
| TriStar Investors | December 2014 | – | – |
Sources: Crunchbase and Crown Castle Corp’s website
Crown Castle REIT Investment Portfolio
Tenant Mix
Crown Castle REIT gets its dividends from rental and management fees. All of their network assets are built on land they either own or have rights to. With a lot of businesses across different industries that need connection, they enter into long-term leasing contracts with clients for a period between 5 to 15 years as initial terms. Renewal periods are between 5 to 10 years.
In exchange for leasing out towers, smart cells, and fiber networks, they maintain their networks yearly through their Network Operations Center. To keep operations smooth and clients satisfied, regular inspections and reviews are done regularly by their technicians and engineers.
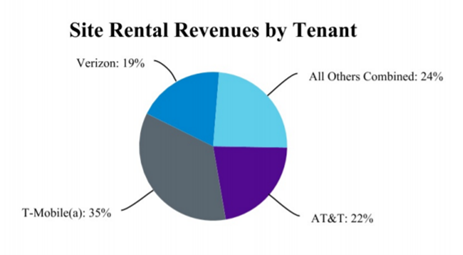 Source: Crown Castle REIT SEC Filings — Form 10-K (FY 2020)
The majority of Crown Castle’s major contributors come from media and communications companies. The largest tenants of Crown Castle REIT come from T-Mobile, AT&T, and Verizon — which sums up to 76% of their rental revenues in 2020. T-Mobile’s share in the pie chart above already includes revenues derived from Sprint. T-Mobile and Sprint merged in April 2020.
Investment Ownership
According to CNN Business, about 92% of the outstanding shares come from institutional investors, while the balance comes from Crown Castle REIT’s Directors and Board of Trustees. Within the REIT industry, institutional ownership is higher than most companies. The top 5 institutional investors of Crown Castle REIT are:
- The Vanguard Group, Inc. (~$10B)
- BlackRock Fund Advisors (~$4.2B)
- Capital Research & Management Co. (World Investors) (~$3.7B)
- Capital Research & Management Co. (Global Investors) (~$3.5B)
- Capital Research & Management Co. (International Investors) (~$3.4B)
Crown Castle REIT Performance Outlook
Historical Price Chart
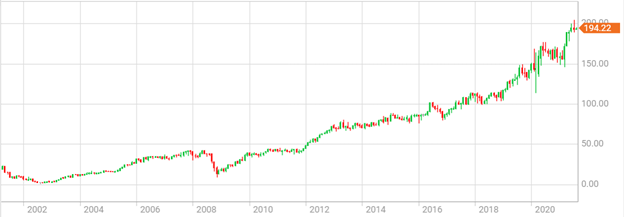
Crown Castle International Corporation (CCIC) has been on the public stock exchange since 1998. But if we’re looking at the start of its operations as a REIT, the starting year would be 2014. The general trend of the historical price chart is going up. Consistent price increases can be observed in 2013 and 2017, wherein Crown Castle REIT doubled in size due to acquisitions.
If you entered in 2014 at $71/share, you could have as much as 173% gain if you sell CCI shares today at $194/share.
Key Performance Metrics Through the Years
The stock price history chart does not tell you the full story. You have to also run the numbers and see how the company managed its investments through the ups and downs of the business cycle. Here are 5 of the critical parameters you should look at to measure the company’s operating performance:
- Total Equity — this represents the company’s net worth value. It tells us how big and valuable the company is in the market.
- Total Revenue —this parameter tells us how profitable the company is. How much does the company earn in doing its business?
- Net Income — this parameter eliminates all the property operation expenses (e.g. maintenance, insurance, and taxes) from the total revenue. It tells us how much is the take-home pay of the company.
- Funds from Operations (FFO) — a common industry standard for reporting REIT operations. It’s the net income available to common shareholders as defined by NAREIT.
- Dividend Payout Ratio — tells us how much of the company’s net income is paid back to its investors in the form of dividends.
With all of those parameters defined, the table below gives you a picture of how well the company has managed its operations within the last 5 years — from 2016 up to the present.
| Total Equity ($ millions) | Total Revenue
($ millions) |
Net Income
($ millions) |
FFO
($ millions) |
Dividend Payout Ratio (%) | |
| Q2 (June) 2021 | 8,713 | 1,583 | 334 | 749 | 172.16 |
| FY 2020 | 9,461 | 5,840 | 1,056 | 2,681 | 207.39 |
| FY 2019 | 10,849 | 5,763 | 860 | 2,338 | 235.47 |
| FY 2018 | 11,571 | 5,370 | 622 | 2,062 | 304.66 |
| FY 2017 | 12,339.08 | 4,255 | 366 | 1,566 | 420.49 |
| FY 2016 | 7,557.12 | 3,921.23 | 357 | 1,470 | 359.38 |
Sources: Seeking Alpha & GuruFocus
The total equity reached its peak during 2017 when CCI acquired its largest acquisition yet from Lightower Fiber Networks. It has slowly decreased up to the year 2020. But 2021 is most likely going to surpass last year’s record. Its total equity in the first half of 2021 has almost leveled to the total equity in 2020.
Despite the decrease in equity, 2020 was one of the best-performing years of CCI in terms of income and revenues. Although, the dividend payout ratio was at its lowest in the past 5 years.
Dividend History
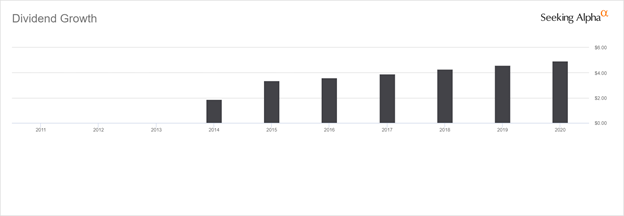 Source: Seeking Alpha
Crown Castle REIT issues quarterly dividends. Since they doubled in size in 2017, their dividends per share have consistently increased through the years with a compounded annual rate of 9%. However, when compared among 461 companies in the REIT industry during the past 13 years, GuruFocus ranked NYSE: CCI’s dividend payout ratio lower than 84% of the group.
How Did Crown Castle REIT Perform Compare to Its Peers?
The top 3 U.S. REITs in the communications infrastructure sector are Crown Castle (NYSE: CCI), American Tower (NYSE: AMT), and SBA Communications Corp. (NASDAQ: SBAC). Let’s compare how Crown Castle REIT performed among its competitors.
| Parameters | CCI | AMT | SBAC |
| Inception Year (as REIT) | 2014 | 2012 | 2016 |
| Market Cap | $83.94B | $127.47B | $37.97B |
| YTD Return | 22.43% | 24.74% | 23.35% |
| 5-Year Return | 138.4% | 163.95% | 202.4% |
| 10-Year Return | 518.01% | 570.02% | 941.33% |
| Dividend Payout Ratio | 84.19% | 51.92% | 22.13% |
| Revenue Per Share (TTM) | 14.03 | 19.27 | 19.79 |
| Institutional Ownership | 92.19% | 89.65% | 94.4% |
Source: Seeking Alpha (data as of August 2021)
The first company to operate as REIT among the group is the American Tower REIT in 2012. They are one of the largest communications infrastructure REITs in the U.S. It also has the highest YTD return among the group.
SBA Communications Corp. is the youngest among the group of communication infrastructure REITs. But despite the short time, it has the highest 5-year return and revenue per share among the group. They also have the highest institutional shareholder composition, which means the large asset management companies have their confidence in SBAC’s investment growth. However, the dividend payout ratio is relatively low.
Among its top 2 close competitors, CCI ranks the lowest in terms of market cap, shareholder returns, revenue per share, and confidence from institutional investors. AMT’s and SBAC’s advantage over CCI is their extensive international operations, which CCI lacks. Although, CCI has the highest dividend payout ratio of 84.19%.
Meanwhile, in their recent SEC Form 10-K for the year 2020, CCI compared its performance with a few market indices.
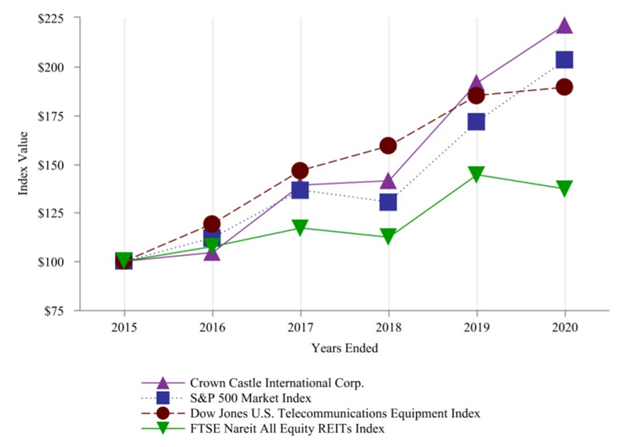 Source: Crown Castle REIT SEC Filings — Form 10-K (FY 2020)
Crown Castle REIT performed better than the S&P 500 Market Index and the FTSE Nareit All Equity REITs Index. Meanwhile, it has underperformed the Dow Jones U.S. Telecommunications Equipment index — its much more specific market niche. Although, since the start of 2019, CCI’s index value started to overtake the rest of the indices. This means that CCI’s business thrived among the majority of REITs in the market despite the COVID-19 pandemic in 2020.
Forecasts from Analysts
In the coming years, CCI is gearing up for the development of 5G technology by 2030. They aim for long-term annual growth of 7-8% in dividends per share. In their Q2 2021 earnings report, they presented the full year 2021 outlook. It shows a positive outlook with YoY growth of 7%, 11%, and 14% based on site rental revenues, adjusted EBITDA, and AFFO, respectively.
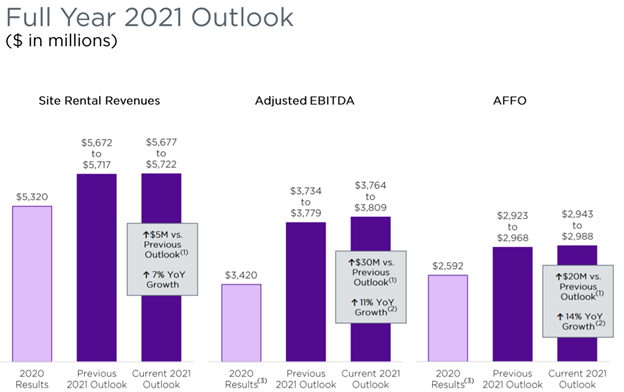 Source: Crown Castle (2nd Quarter 2021 Earnings Conference Call)
- Adjusted EBITDA represents the pre-tax income of the company.
- Adjusted funds from operations (AFFO) represents the actual cash received to be distributed as dividends.
- Site rental revenues are from long-term rental income from the REIT’s clients.
For more information such as detailed analysis on performance outlooks, sites like Seeking Alpha are good resources for your investment research. Below are their estimated charts on revenue and FFO for this year through the end of 2022.
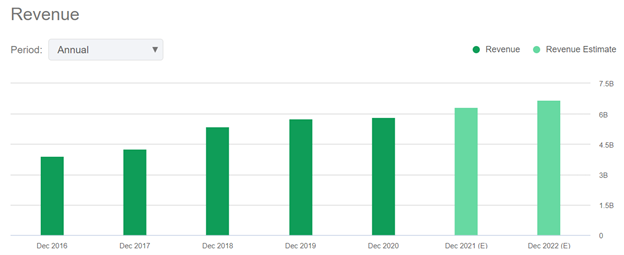 Source: Seeking Alpha – Crown Castle REIT
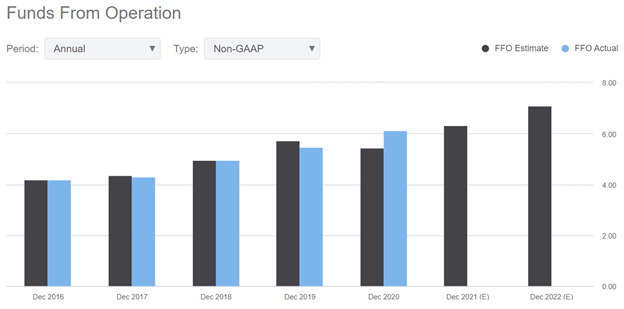 Source: Seeking Alpha – Crown Castle REIT
Check out our other comprehensive look into more specific REITs here.